July 29, 2010

Morning Post, SPX, S&P 500, e-mini

One last chart - updating the one below. Ran up to the 200ma and upper BB on the 10m chart. 

1:00 - Nut cuttin Time!

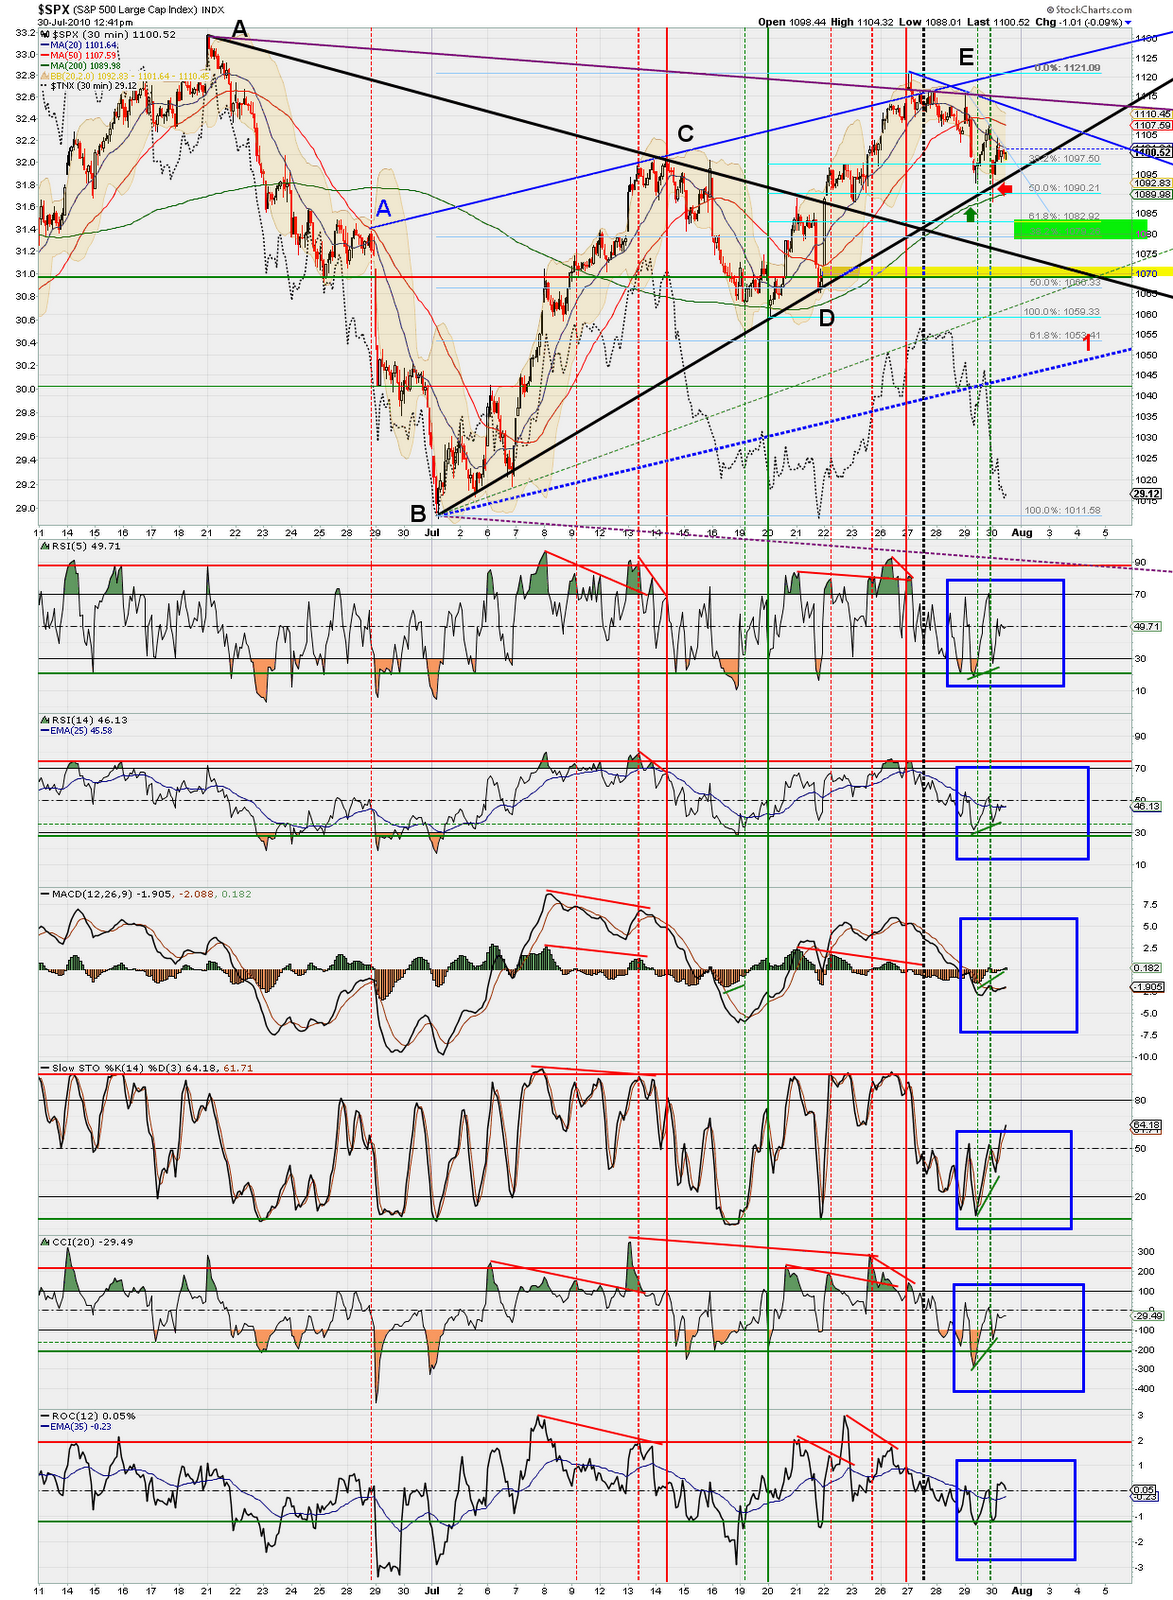
12:40 - Decoupling Is Back After Plunging 10 Year Yields Reflect 10 Point ES Disconnect

A while back I added the $ - 0 - SPX - 30 min - One Month chart. The disconnect is obvious, but not something that is a must. Whether the AUD/JPY, ERU/USD, the USD or the TNX - whatever is the hot ticket du jour the market will follow it or relate to it like a blind puppy.


11: 51 - Boredom  - so watch this and freak out later.


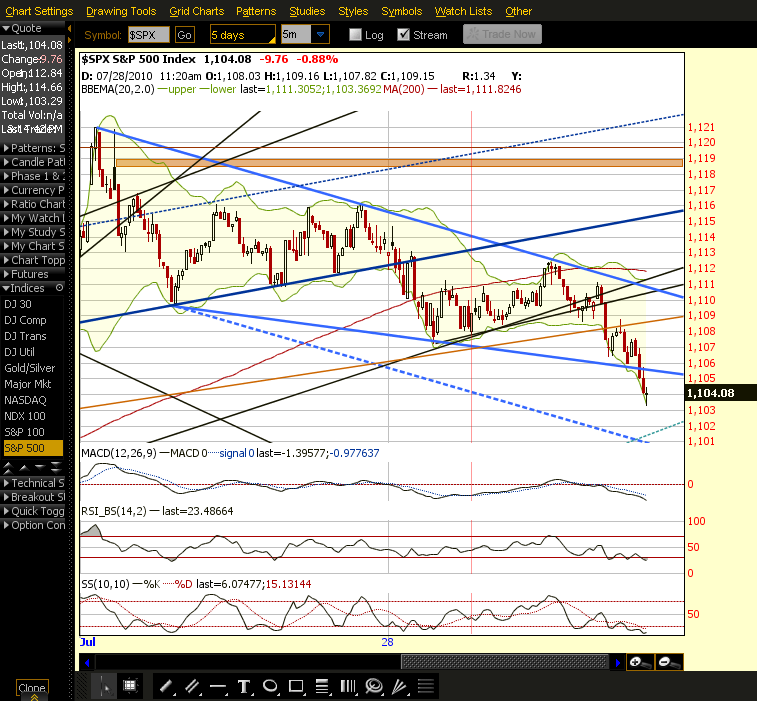
10:15 - follow the blue dashed diagonal. Nailed it and reversed like clockwork.  50% retracement from the 56 low and nailed the 89 support area. Still digesting what the fuck is going on here.

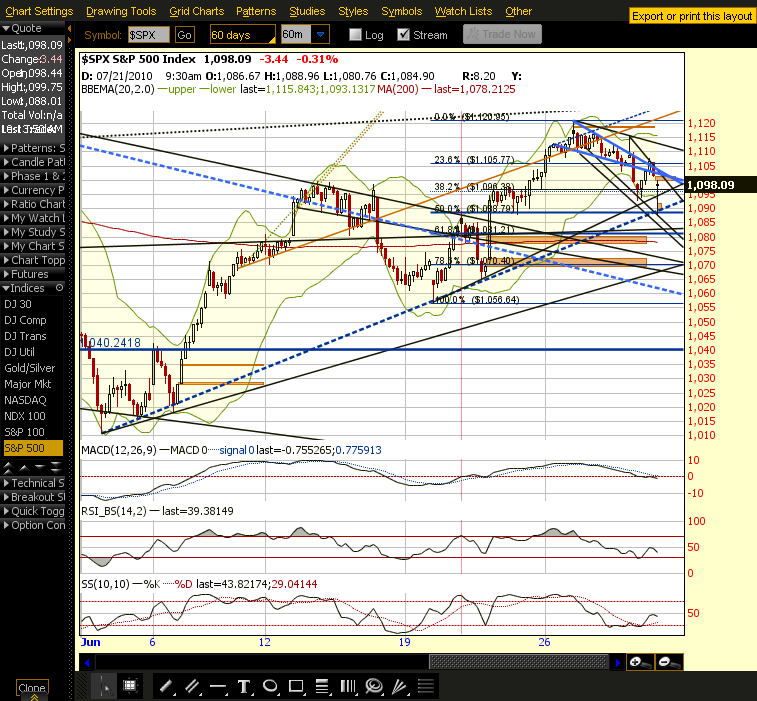
10:00 - DOW chart - Spiking thru the 60m BB's on top and bottom. Can't get momo in either direction. All the lines in this chart are pretty solid I think, so you have a bunch of support points and resistance as well. Sum bitch won't move for some reason.

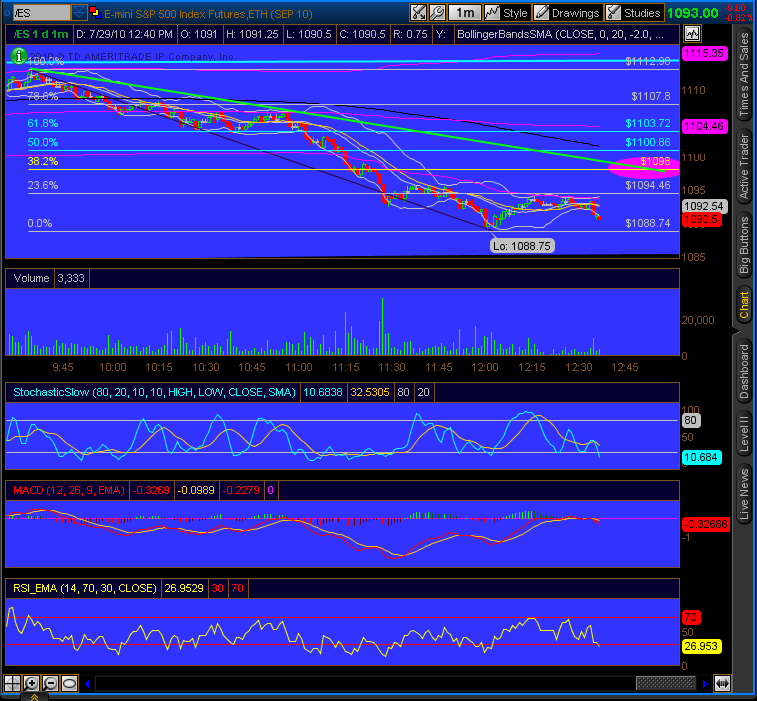
Here is a little different look at the minis from my home computer on a daily basis. the wedge is real clear and the indicators are toppy and are actually following SPX's lead right now lagging somewhat.The two gold lines are the massive P2 wedge playing out. Can't wait to see what happens at that apex.Minis are down 6+ at midnight and resting on that lower TL if it cracks the shorties may be in business. If EWT is right we'll be in a nasty 3rd wave down then. I like the way the markets are setting up for the 3 to play out. I'll say we may still be a bit early for the big nasty.

Not commenting on anything till all the econ indicators report. I'll say that you need to have your finger on the trigger willing to shoot either way. I assume down will be the appropriate direction. We now know that it was this announcement Already Bought A 3D LCD In Anticipation Of QE "Instarefi" 1.999? You May Want To Consider A Refund that moved or reversed the markets from what should have been a free fall.  I updated a bunch of charts. That reversal today really screwed up the ST charts indicators. I'll say I do like the ring that "Flash Friday" has to it. GL!

Economic Calendar -

8:30 GDP - Can you spot the government stimulus in the blow chart? Can you spot the absence of it?
 

9:45 Chicago PMI -
9:55 - Consumer Sentiment - Will it be another stunner? The markets may wait on this number to really get moving.


Morning Post, SPX, S&P 500, E-mini

3:00 - SPX channeling up. Topped at 1106.36. Maybe that counts as 1107?

2:10 - Something I am working on. possible 805-815 target for 1. Nothing is in stone. Link to chart HERE. OBTW we're possibly headed south here again now. The 98 pink circle below looks to have got it on price but not time, sorry. Standard 38% retracememt.

12:41 - Possible ES target for corrective.

12:19 - yesterday morning I gave you this "nugget"  - 9:57 - Minis holding their upper resistance so far. Indicators diverging. See that apex at 81/79 tomorrow just before the open? 200ma is at 86. Might be a magnet. Market is dead right now. Not sure what this confusion means. I'll assume since there is not leadership either way after the big bull run the bears might get control back. This is strange."

Well, If I had been a little more serious I might have gotten the time better, Keep an eye on this area as stopping point #1.


11:33 - DOW and target/support lines.
AUD/JPY - Anything below 77.82 and it is gone.

11:20 - Not good (again) The blue dashed was the target line for the last wedge up. Price did not even blink going thru that.


Sorry I am late -

This is not good.

July 28, 2010

Morning Post, SPX, S&P 500, E-mini

3:15 - Throw under or a crack?  Entering an area of some support.

2:00 - Trying it's hardest to fall. Look at the gaps down and then the recoveries. 

12:32 - Short candidate - PPL

12:15 - Toast anyone? AUD/JPY

12:09 - Copper -  Looks like it still has some upside left. There is that damn weekly bullish signal I keep seeing everywhere. It will have to get whipsawed. $3.55 upper TL is the max if it should get there.


11:50 - Consolidating with 1111 as resistance.  200 DMA is at 1114.That brow/tan line is key I think. It is a diagonal that divides S & R from 07/09 lows.

10:33 - Crude - get it - CRUDE! Yet another sign the recovery is just ramping to the moon.

AUD/JPY update: 77.17 is the 200ma.

9:57 - Minis holding their upper resistance so far. Indicators diverging. See that apex at 81/79 tomorrow just before the open? 200ma is at 86. Might be a magnet. Market is dead right now. Not sure what this confusion means. I'll assume since there is not leadership either way after the big bull run the bears might get control back. This is strange.

9:51 - Uh, did they close the market this morning? Yes, that would be a crack. target 1101 if it plays out.

From the big blog -

http://shankystechblog.blogspot.com/2010/07/morning-post-spx-s-500-e-mini_28.html

It is quiet now. Keep an eye on things.

July 27, 2010

Morning Post, SPX, S&P 500, E-mini

3:59 -


Leprechaun -

1:34 - Meet you at 1100? H&S nut cuttin time. 

AUD/JPY -  looks toppy to me. Lines, lines, everywhere there lines. Blocking out the scenery and .....

Chemtrails anyone?
 
12:25 - RS Update -  Still a possibility - target 1100 - that is to good to be true if you ask me.

12:11 - DJUSFN - I had NO IDEA that it would make this point and especially in such a short time frame.
Resistance everywhere here. RS completing or still in process.

This is the H&S breakout measurement (yellow lines).

 11:40 - 

11:28 - Particularly Fugly chart. 

11:20 - Time for a right shoulder or does it just let go?  I don't think it backtests the wedge. that would require a higher high.

10:48  - Minis - 30m - Crack? Or is it going to reset the lower wedge support and make one last gasp higher? That sky blue support line is all that's got it now. Next stop is 92. Either way we're close. Lats stop for the bull train. Last stop for most likely several years at this point. 

Rich sent me this - it is awesome.


10:40 - Reversau candle on 10m SPX? Hey, its possible, right?


Hope no one is short the financials this morning - It has morning wood for sure. Alas, what goes up (and especially this fast) will come down. (well, eventually - you see in a normal market after fraudulent stress tests and proven massive liquidity issues and a consumer down for the count all have proven great rallying points for this market, that should end one would think).

Minis up 7 - it is getting to parabolic (well, for a normal market). 30m minis is about to roll over. It got nothing but sideways action out of the last two 30m cycles so it is either gonna flatline for the morning or head south.

July 25, 2010

Morning Post, SPX, S&P 500, e-mini

4:33 - ABC or does the lower support line get reset and we have one more leg up? Those indicators are getting pretty embedded (but we all know all to well just how embedded they can become).


12:25 UPDATE - Minis 1hr chart. 200ma and 1081 support look great here (as a first target. there is still room to run up. check out the blow off top (busting divergence) on the RSI. 

11:21 UPDATE - updated 30m SPX chart - I really have to go with this being a ST blow off top. Pay attention to that apex point of the black triangle.RSI14 finally topped and is nearing the red market top line.

OK - Confusion still reigns, but these divergences are getting out of hand. Triangles, wedges, ABC counts and of course rigged markets all add up to a bunch of nothing. There is no clear path right now. Sorry bout that, but that is the way it is. I could pull one chart and say up and another and say topping. Overbought is not a given, but then again could it be? You know what I think, but that does not matter in this game. We have learned to follow the hot hand and that is what I think we need to heed till more clear turn signals are in place. Was that a legit breakout last week? Taking out the upper resistance line on a big green candle might be something we should pay attention to. But what about the divergences on the ST charts? Hell if I know? My 30m indicators are saying blow off top here. I can make a great case for either an ending wedge or a throwover is in place right now and we're gonna get crushed soon (which I like), but for some reason I can't buy it right now cause the daily and weekly charts are still climbing (and earnings fraud and manipulation are rampant). My 1111 target is right around the corner. Anything above that and I'll start freaking out and looking for a double top possibly above 1200. I did have a 1140 target at one time. We just have to digest and be patient. the stress test fraud and a few other actions are masking the truth. Sadly we'll all get abused in grand fashion sooner than later. We just have to be ready when it happens. I'll get it right, it will show it's hand and we'll kick it's ass.

Let me see the minis in the morning and we'll go from there (up 2.5 at 11:15).

GL!

July 23, 2010

Morning Post, SPX, S&P 500, E-mini

1:27 - Laughing even harder now. What 4.5 point gap down?1100 or bust. They made it!

12:20 - LMAO- That black spike did set a higher high.

12:11 - AUD/JPY -

12:05 - UPDATE - A 3 point RIP in 1m. wow.

10:38 - UPDATE - RUT possibilities - We're in a 3 up of C OR we're ending E of the A-E triangle (which would be topping 2 of 3 with A on the chart relabeled as 2). The Triangle count looks nice here as we could be completing an ABC corrective at this point and the larger upper resistance diagonal with overbought indicators. The larger ABC for 2 looks nice cause A counts better as a 5 and not a ZZ and b counts as a 3 better IMO. So the confusion reigns (my CPC chart is just as confused). Markets are rigged and confused.

10:00 - UPDATE - This chart does not look good. It may be like the past ramps where there is no support and it just gives it all back. The blue dashed diagonal near 77 would fit nicely with my minis speculation. The daily 50ma is at 85 which is where this wedge might end. 

Morning. Minis at support and backtesting busted diagonal from yesterday.I am liking my 1111 SPX target more and more, but am not discounting a fall from here. The divergences on this 30m chart are really bad. ANY strength that pops up and busts the divergences I am anticipating will result in a blow off top and great shorting opportunity. More to come later. At support, if it cracks 81 is the target. That area at 74 with the VWAP and the 200ma might be a magnet. I forgot to add that the upper blue diagonal would be the only target for a pop. Nothing above that at this time.

I have to throw out an apology to Rich. He did not appreciate my "intern" comment the other day. The man is a mentor and very respected. Sorry bout that pal.