August 18, 2010

Morning Post, SPX, S&P 500, e-mini

4:00 - Minis just held their range.30m is oversold and looking to turn. This could EASILY change by the morning. Have a good one.

12:15 - Minis back at 70 support. If this level goes and they get below that 66 low look out. I really expect consolidation here. 

12:00 - This chart is a bit fugly, but what I want you to see is this low on SPX is where it meets the wedge target line (fat red). If this level is taken out it should churn to 55 I would suspect, but once 55 is gone the race to 1010 is on. There ain't nuttin to stop it from 55 to 10.

11:55- If that completed a right shoulder this is a possible HnS FLASH CRASH alert! 45 points if it is right. Wow, that would be a brutal right shoulder HnS  to hit the neckline of a possible larger HnS to throw the PPT under the bus for good.


11:16 - My 1m Rut Chart I cleaned up last night for Incarnate with HnS and target. LOL. 614 baby! For those of you that use the chartbook, if you do not religiously vote for anyone else please take the time to go to the bottom right corner and vote for me. I get free time if I am a leading vote getter. Also if you sign up use me as a referral.


10:09 - Christmas comes early at Shanky's site! I'm digesting. So the fall stopped at 77 (so far) and not 75. Sorry bout that. Can't get 'em all right. Lawdy I love it when the divergences line up with a HnS. That was textbook sweet. Not sure if anyone else was calling that or not. Gaps filled below that were around the 80's.

I'm digesting and enjoying the sweet fruits of victory at this moment.


9:33 - Bounce at 87ish Up to backtest the HnS neckline at 95/97 and get gaps filled then fall to the 75 HnS target - Ready....BREAK! Of course if the 87 level fails we can just go straight to 75.

9:30 - This is what the markets (and all shorties) want -  They just won't let them have it. That is a 10 point 1m candle!

Markets quiet after the minis dump after the close. The 30m chart in yesterday's post should say it all. More to come later or in the morning.
And now you have to ask yourself - Did the market or someone KNOW this move was coming in the EUR? I'm not saying things are manipulated or anything like that.
Apparently the Dollar has a flight to catch and it is in a hurry to get to the airport.
 An update on the range bound $DJUSFN and it's head and shoulders pattern
 I'm one of the few that think the Dollar is gonna get crushed and this chart to me shows the pennant or flag that was only a stopping point on the way down. It helped me NAIL the 89 top (like almost to the number months in advance). Now, the dollar with a 6 handle is a real possibility, but I have seen a H&S pattern that could leave it destitute with a possible 4 handle. Ouch.

Morning Post, SPX, S&P 500, e-mini

Minis after the close - Think someone wanted A) for the market to close green and B) Also wanted to get the hell out?


3:36 - RUT

3:33 - SPX possible RS coming in. 

3:28 - COMP H&S


2:50 - Potential H&S on SPX. 1074 target if it is right. 

2:11 - SPX 30m with nasty divergences.Yesterday I pointed out that the 30m was not that strong a sell signal. this is really powerful. Nothing is guaranteed of course. Setups like these have been blown thru in the past and they will fail again. The 1100 resistance is there and if that cracks 06 is the number and the 17 of course. If you short it, tight stops are mandatory as you are trying to pick the top of a nice bull move and it can rip you a new one.

11:48 - Let me set this one up for you - the Rabbit is the HFT Algo Bots and we're the crusaders. We're to ignorant to see all the short carnage at the mouth of the cave, so we attack anyway.....RUN AWAY! RUN AWAY


11:00 - RUT Triangle 

10:09 - SPX 1m with gaps and fib.

9:35 - I have to go digest trading opps now, but I'll report back soon. Here is my ToS SPX 10m chart. Looks bearish with price tagging the 200m, busting thru my wedge target line and possibly holding that diagonal above the 200ma. IF THAT CRACKS she's gonna take back all that move down to the 80 range near gap support and the 61% retracement. I'll caution about the bears getting some real momo today. Looks like the futures were a tease. 


9:34 - In cash. Minis took a hard move south for some reason. The SPX 30m below is in a confirmed sell mode so the trend should remain down near term. It is now retracing 38% of the climb at the 88 level (what I was looking for yesterday). If that cracks and the 60m kicks in the downward pressure may build. On the big blog I voted for consolidation with a wide range between the 50 and 200dma's. I have wedges on all my 30m charts that if they hold this sell off may get pretty testy.


Minis flat. All the 30m charts look weak. I updated (finally) a bunch of charts in the chartbook (no Inc, sorry I did not get to the RUT section yet). I'm still digesting the fall from yesterday afternoon and it's validity. I want to see the action before the open before I make any calls. The 60 and 30m charts say down, but the daily was just beginning to show some strength. So, the indicators are not on the same page,

I'll be back in the AM with hopefully a clear picture.

August 16, 2010

Morning Post, SPX, S&P 500, e-mini

Updated SPX 30m Chart - I'll comment on it in the morning. 

4:04 - Sorry for the lack of charts after the last one - I gots to be trading sometimes. See you in the morning. 

2:34 - SPX 30m chart. Possible wedge forming. 30m MACD is not ready for a turn yet. Small divergence on RSI5. 

1:41 - Possible SPX wedge. If it cracks it could retrace all the way to 88 level. 

12:58 - The SDS corresponding Island Bottom. 32.11 closes it and backtests the TL breakout possibly.I'm just pointing out that it exists and it is a good reason to be cautious. Plus this 60m chart still looks bearish.

12:22: What would POSSIBLY be max pain for shortie?  Pick your flavor. Not saying they are all going to bottom and consolidate again. This is not anywhere near that tunnel vision move we had early this year, but do they all need a dead cat bounce and one more period of consolidation? Just asking.

11:16 - You gotta let it play out here. This 30m chart should tell the story (unless this is some sort of real BS manipulated move). At this time I'm thinking it is possibly a blow off top and not part of anything larger. If it continues thru the day, then the set up to short the open may be really good.

10:32 - Rectangle continuation - Read about it HERE at stock charts. Cleanest chart is on the minis. I like them holding resistance this morning.I do not like the way this 4hr chart looks. A big down vol candle would be nice to set off the pattern.

9:27 - Looks overbought here at resistance, but we all know that means little in this manipulated POS market. Just keep that in mind. Not sure how sound this wedge is, but it has enough points to count. I'd say a pullback to the 200ma or the VWAP here near 83 would be in order. Maybe not though, we'll have to see just how bullish it gets. the SPX 50ma is 87.5 which may set off some sort of market reaction.

Minis up over 7, but I think that will change based on the resistance and where the 30m indicators are. We still have numbers to come this AM, so that is a risky call. This 30m chart says it should be week or at least have a muted climb from here if it does.
 

Minis up 3 at 11:30 tonight after being down earlier. Not sure how the market will react to all the economic data in the morning. There will be a bunch of it. None of it really matters as it is all a bunch of manipulated crap that gets revised downward and even then the data does not tell the truth. Should be interesting. Several are expecting a pop. I am still leaning that way. I was surprised at the late weakness this afternoon. I thought they'd be able to ramp it up. The markets are really screwed up. It is only a matter of time now. I'm not sure if we will see this one coming or not. I suspect the big one(s) will happen overnight and we'll wake up to a closed market one morning (or two). It is gonna be really scary.


Economic Calendar -

I've been really lazy withe the charts. Various reasons for that. One main one is that they appear to be broken somewhat to me, and I hate updating busted charts. No, not kidding about that. Sure I see patterns and indicators, but now I'm seeing (or feeling) a disturbance in the force. I don't like disruptive things. I prefer order in my universe (lots of it). I think the dislocations (like the 52wk hi/lo offset) are fucking with my sense of structure. Yeah, I'm seeing the patterns and reading the indicators, but I'm feeling something different. Usually I can call a crash a day or two in advance, but this time the feeling is different. Not sure how to describe this one. I see the 5 waves down and the setup for a potential pop or fall for that matter, but I just feel something different. It is strange when I start feeling things. Hard to describe that. What is strange is I am not feeling a specific direction. Just feeling something. Like a disturbance in the force. Sorry for the ramblings. Just had to get that out. We'll know in a few days what I'm feeling I think.Yes, I'm strange like that. We have a 75% chance of something happening I'd say.

See you in the AM.

August 15, 2010

Morning Post, SPX, S&P 500, e-mini

10:52 - RUT looks a little bullish here - Let's see what happens around 620.Bulls need confirmation of the recovery this morning. If they do not get it down she goes.

10:20 - Here is the deal - Hindenburg Omen describes massive market confusion. That is what we have. 52 wk highs and lows all over the place. As for SPX, if that move this AM completed a 5 then up we go to the 92 to 97 area before it craps out. This is pretty much what I have been calling. If this move turns into a 5 and is not an ABC that will be the tell. Right now backtesting the busted 4th wave triangle and that dashed black resistance line. Heads up here for a move in either direction. Stop tight.


Sunday night. AUD/JPY falling for now. Minis down a smidge. EUR and DXY a little sleepy still. Did not get a damn thing done this weekend. Sorry, kids rule I guess. Day on the lake today was insanely fun. I'll have a read on things in the morning. Mondays tend to go up and I'm still leaning towards a possible 30m pop to possibly 97 on the SPX. Lord I hope we can get a day to remain meaningful form start to finish. I'm not saying it can't just spontaneously combust and put on a great show for all to see. More in the AM. I hope all had a great weekend and have a real successful week this week.

August 13, 2010

Open Post

Leave a note with feedback about the site or some comments. Or just speak your mind.

Have a great weekend.

Morning Post, SPX, S&P 500, E-mini

I'm out - everyone have a great weekend. Thanks for the views. 

3:46 - Possible leakage.


3:22 - Price like water seeks level - Minis 1m move from upper VWAP band to lower and finally zone right in on the VWAP - Its AMAZING!

2:39 - What the fuck is that? friggin what? did it quit? Possible HnS breakdown back thru triangle resistance. 

2:10 - SPX triangle update - Overthrow or breakout and backtest or a new upper resistance line point? Based on 10m indicators it is an overthrow. That black dashed line is the upper resistance line for this bear move. 1086 is still resistance. 

2:02 - Never mind price, let's do a minis volume check - What volume? I waited to get that last bar in. This is anemic. 

12:23 - Is the Triangle finally revealing its self? Are we fools for playing this rigged game?

12:03 - And in other news at 12:03 today the markets were declared dead as all life support functions flat-lined. 

11:36 - Slippage? 76.69 is the next magical number.

11:33 - Waiting on the EUR? Sitting on support and 38% retracement at lower BB. Those daily indicators look ill. 

10:50 - Looking weaker - any move thru 80 on SPX should trigger some sell signals.Still in the range though.

10:39 - ARNA is a short candidate. Not a short at this time. Put it on your radar. When the market turns next time this one has some room to fall. 

10:25 - Support and resistance - something will give soon. 

10:15 - Markets may be dead - here is a chart for CSCO. I'm not saying to buy it or sell it. I'm pointing out that it is oversold and has left TWO uncovered gaps all the way up to the 61% retracement near 23.40.There is room to fall as the lower daily BB is near 26.5. Dailys look weak still. Just keep an eye on this one.That is a blown out 30m BB in this chart.Let me add that this sort of carnage is what you should expect to see all thru this fall. Lots of uncovered gaps to come I suspect.I'd love to see a lower low to set a divergence.

9:37 - Minis 30m look bullish.This is not a buy signal, but a screaming caution signal to the bear.Squawk still has muscle to the short side.

Morning - Off doing the big blog - At this point in time I have to vote for an oversold bounce sooner than later. I'm not guaranteeing anything as there is no reason for any bounce at all (plus the Hindenburg Omen). I think we'll get a flurry of announcements that are false and misleading from the Government and businesses to try and stem the tide.

Here is the RUT (the leader of the pack). Maybe little more weakness and a pop to 640 or posibly backtest the blue wedge support line then more severe weakness. If no pop, just severe weakness LOL.

August 12, 2010

Morning Post, SPX, S&P 500, E-mini

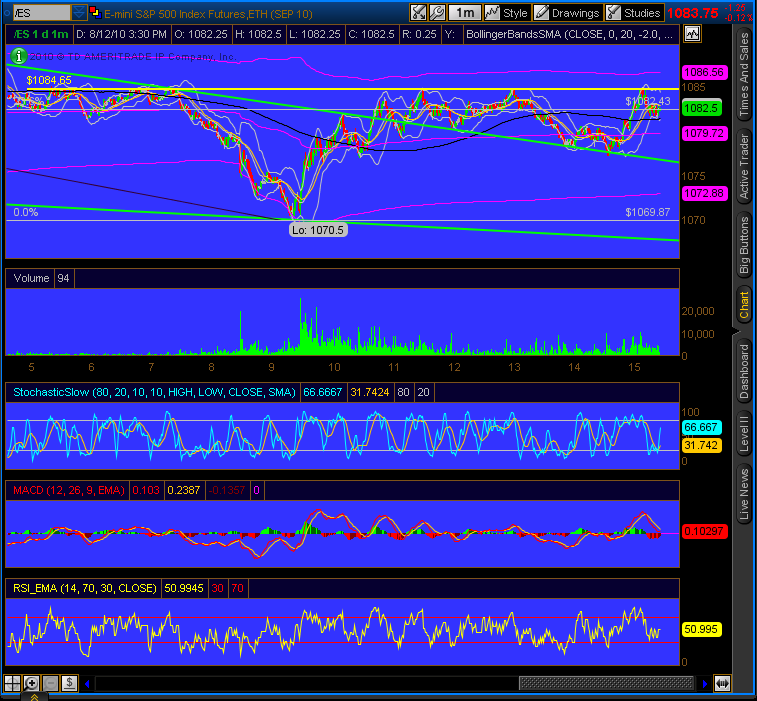
3:37 - Line in the sand - 87 if that cracks the bulls will be happy.

3:30 - Resistance on the minis at 84 - if that cracks the longs may go ape shit. 

3:10 - Tiggers are wonderful things - Bouncy trouncy

2:40 - Minis falling but holding TL so far. 

2:06 - Backtest or breakdown. We'll know soon. 

UPDATE - Possible SPX wedge - 

UPDATE - This FAS HnS wors well with the one on the $DJUSFN - You do the target for this one?Ominous I'd say.

UPDATE - Island on the RUT -


UPDATE - Minis coming into support. Possible green wedge. 30m is unclear as MACD may be whipsawing.Possible backtest of the 97 S/R level coming here.


School is back in, so some more informative morning posts are coming again. Still behind updating the chartbooks in SC, sorry bout that. Below you'll see lots of reasons the market should begin some sort of sustained sell off. 

Dollar - $DXY - bouncing off the 61% retracement and the 200ma with BUY signals on the daily charts (You UUP fans need to be alert here).


EUR/USD - falling again today. Sitting just above a support line at 38% retracement. Daily sell signals.
AUD/JPY - this chart shows the consolidation and support. Daily sell signal as well.
Gold - /YG - I think it is backtesting the wedge breakdown after bouncing off the daily 200ma.

Natgas- /NG - Right in the middle of the range. Weekly RSI and S Sto look weak here. I think the churn down continues.
Oil - /CL - The corrective wedge is consolidating even more now after completing a 50% retracement. Testing lower support. Daily sell signal (yet again). Volume is going away.
SPX daily indicator chart - What strength there is on this chart is fading fast from what I can see. Hard to see, but that spike in the dollar should be very telling. Interest rates crumbling is another tell.

SPX 30m - Lawdy I love my wedges. Pulled back right to the green targeted double fib confluence are. Dashed blue line it the wedge target line. 30m is bottoming, but no divergences. You may get one this morning with the drop from the jobs number. This puppy may embed. We have to keep an eye on it.
Minis - /ES 4hr - Still some room to fall on the indicators. Blue dashed is wedge target. Not sure at this time if the yellow dashed diagonal is important or not. It may be so it is there.
OK, chart mania is over for today. The big question is how well the PPT and BD's can support the market and where do they choose to do it. Look for round and support levels for them to pick their battles. I would not add to any LT shorts here just yet. We need some sort of pop after a 40 handle drop. So' we fall, maybe the 30m chart cycles for the pop, then we fall off the cliff.

GL out there. Thanks for all your support and views.