September 13, 2010

Morning Post, SPX, S&P 500, e-mini

4:04 - Well find out what this diagonal is all about at the open. RUT may have finally finished that 5th wave. I added a parallel line to the chart below it. I think it captures the range nicely.Id that cracks I think you are looking at a minimum of 27 38% retrace.60m is diverging and overbought. 30m is just the same. 15m is barely hanging on to the MACD bear cross.

12:36 - RUT 1m channel down. Looks like a corrective here at this point.I think it is a 4th wave and we may have one more pop left, BUT the top could be in as well. That red dashed diagonal post earlier may have been it.

10:58 - RUT - The slightly unorthodox dashed red diagonal may MAY be it. My stops are tight.

10:32 - Just follow the black lines under the indicators. When they begin to go so does the market. MACD is there. RSI 14 is the key IMO. I believe this is a blow off top based on the blown thru divergences on this chart and the 30m. When I put a red solid sell line on a chart it usually holds. Last night I put this one there knowing the futures were up. That should demonstrate just how irrational (IMO) this move is. Sorry I did not update the chart.

10:16 - SPX 4hr chart - Getting pretty toppy but not there yet.Closer for sure."They" whipsawed the S Sto, the MACD hist and the RSI divergence.

10:07 - 30m Index comparison chart. There has not been any significant pullback since the 40 lows on SPX. The daily below will show you how your favorite index is performing compared to the rest.

9:53 - $DJUSFN - Trading range is obvious. 
A closer look shows the 200dma has been some serious resistance and the range. Once again we see an overbought daily chart for all indicators other than MACD (which can lag the markets).


I think RUT charts the best for what is happening and may top between 60 and 51 finishing this 5. It will clearly break out of the 4th wave triangle this morning and could run up to that upper purple diagonal. I'm not positive that it gets to that line. We're looking for the C touch in the A-E wedge and for the top diagonal to be set. I think it is as it should not get any steeper than it is. The Green Team is in control now and they are taking advantage of this period of the lack of data that have been hurting the markets.


Just putting something up. See you in the AM. See the last post for some charts.

Minis up over 9 now WOOOHOOO!

September 10, 2010

Weekend Post - Open Thread

Minis Sunday night - After that sweet little gap up (Minis don't just gap all the time you know (especially in this environment) I could probably adjust that diagonal up a smidge and make that gap run over the diagonal (which one would expect with a major resistance breakout). They seem to want to keep on rising for now. The difference between this week and last is that price is now above that blue market resistance diagoinal opening up the possibility of a legit breakout. Wasn't it nice of then to whipsaw the 4hr indicators?


"The state of Pennsylvania has stepped in to help its capital city Harrisburg avoid a default by advancing next year’s state aid so that the money can be used to make a $3.3m bond interest payment due this week." I guess that was good enough to boost the futures. Pull it forward. How long can this continue. I'd guess another year max.Folks, this is a GO bond. "The $3.3m payment due on September 15 is an interest payment on the city’s general obligation bond sold in 1997. Such municipal debt is sought out by many investors in the $2,800bn US municipal bond market because the GO bonds have a reputation as being safer than many other types of bonds."


Minis up 7.5 already! Obviously still in a tussle with that blue upper resistance line we've been looking at all week.


Say what you want. Post what you will.

Remember 9/11.

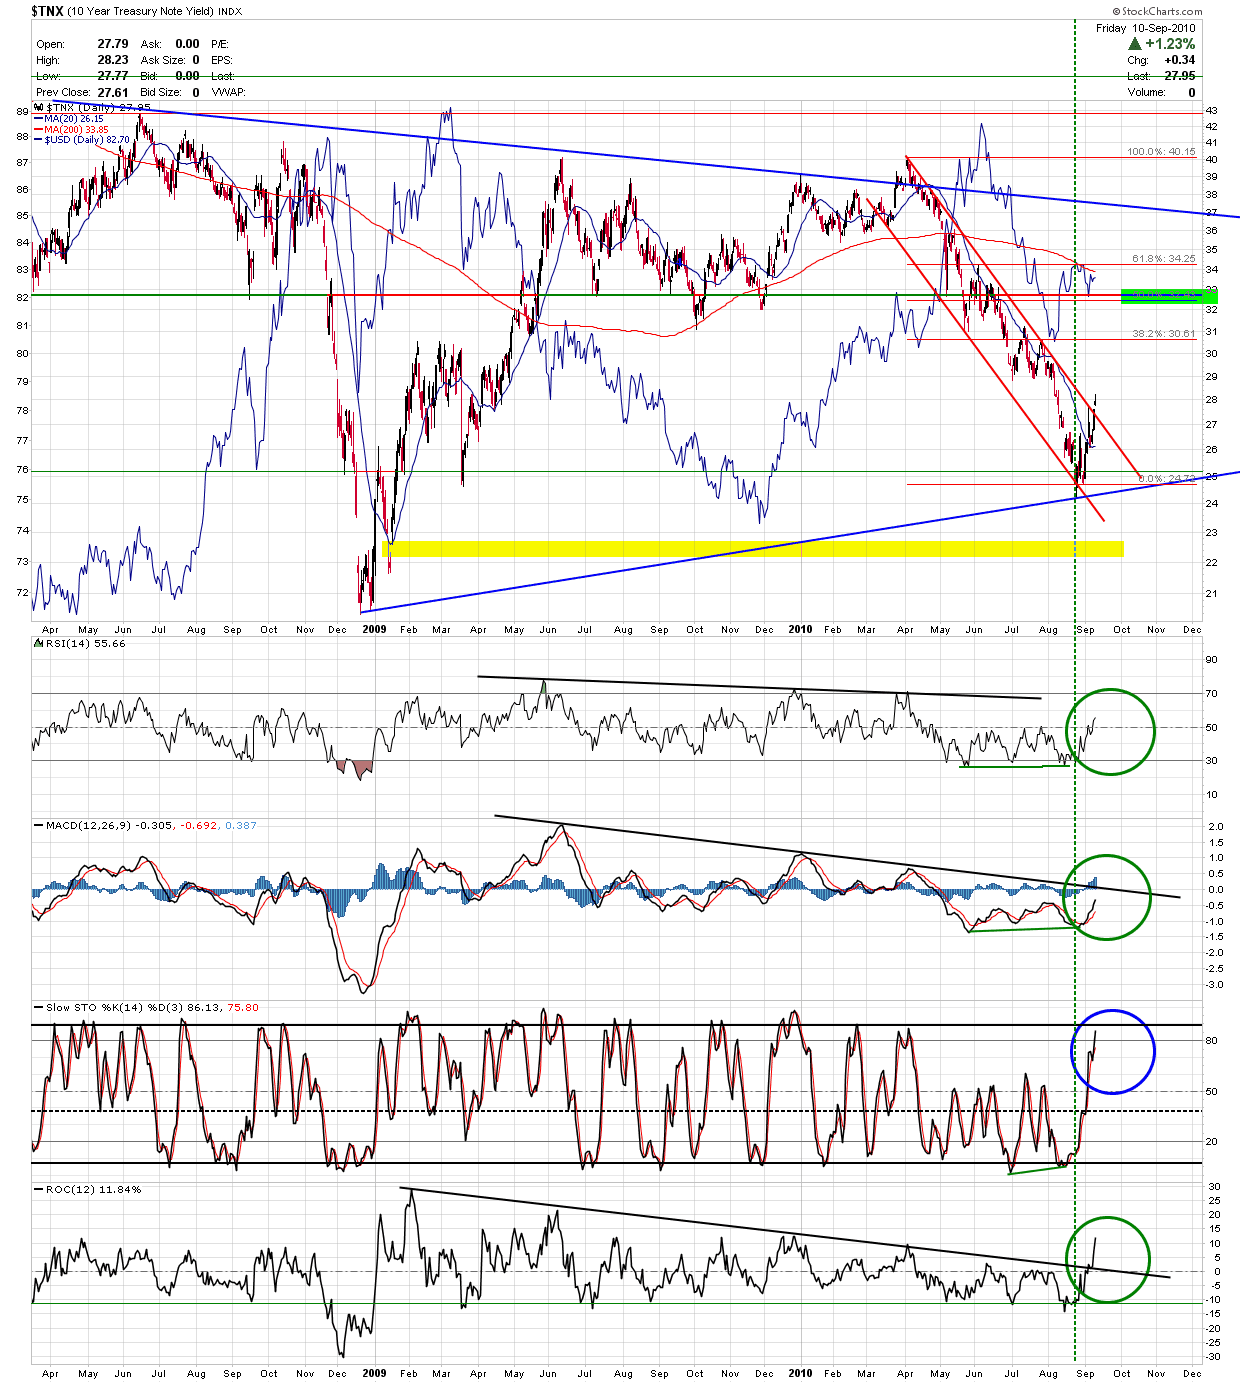
TNX daily - Channel breakout?

SPX 60m - Topping here. Follow the black support lines under the indicators and see where they are running out of room. This works well with the daily indicators that are close to meeting the minimum topping requirements I have. POMO Monday and no real economic data till Thursday.

I'm still thinking ABC and not 2 of 3 despite the topping dailys. Maybe this is my conservative nature or my fear of manipulation. The weeklys are indecisive. Either count is possible and the form of the pullback will tell us what to expect. Impulsive - we get thru 1000 - if not - 92 to 80 pullback for B then up to the mid 20's. Consolidation into November is another option and the upper diagonal for that may not be set yet.

Morning Post, SPX, S&P 500, e-mini

3:15 - Nothing orderly about this chart. Nah, it does not look like programmed trading. Dig the no volume to spike to no volume to spike.I guess you just buy it and put it to bed. Oh - it is popping again here.

1:55 - well, we know the support line is right. Now forming ascending triangle. Can't believe that RS did not break down with all those divergences working for it.

12:33 - SPX double top HnS? Target 92. 

10:20 - SPX triangle - I may not short till the lower support diagonal cracks. This is the triangle that is trying to break out now. 

SPX -  Looks like a classic rollover set up to me. I have seen these back in April that were very frustrating to bears as they simply prolonged the inevitable. I'm thinking ABC back to the 80 level. (might have to broaden that range to 90 /75).

Minis Daily - This is just a clean chart for you to take a look at. Blue channel with price testing the upper channel resistance. The dashed line runs from the top in '07 across the top in April, thus making it the new bear market resistance line. Yellow are support and resistance and define the predominant range price has been in since late May. Volume is horrific and volume yesterday was off the charts low. Indicators still have room to run here. The weakening and diverging RSI, falling MACD hist and the S Sto possibly nearing a bear cross all fit well with price meeting resistance at the upper channel line. Sadly, that channel line may need some help if it is going to hold. The 30m charts may be coming to the rescue here.

September 9, 2010

Morning Post, SPX, S&P 500, E-mini

Possibilities are endless as far as counts. Today being a POMO day makes the "box of chocolates" market even more difficult to forecast. That upper resistance line has been giving price hell. Well, had been. 451k jobs, 27k drop. Maybe the Fed won't have to waste the POMO funds. Minis spike to 1103 and halt, so only a 6 point pop on that. Range today is 94 to 04 at this point. Markets broad range is 92 to 07. 100 to 97 is support. Below that you get 95 and 92. The VWAP is 98.5 and the upper band at 05 lower band at 92. I really want a higher high here (07.25) to set a really clear sell divergence. There has been a smaller divergence set this morning. Markets not reacting much at all to the jobs number (they shouldn't really 451 is a bad number).

September 8, 2010

Morning Post, SPX, S&P 500, E-mini

2:33 - SPX - retraced just over 50% off the 91 low and reversed. Now it is at a 50% retrace oof the move off the top. If it gets much over 1100 I'd be careful short. I don't trust 'em and they took all the momo away from that move. It does look toppy here. I guess the Beige Book spooked the markets.

http://www.zerohedge.com/article/oops-beige-book-sees-widespread-signs-deceleration

2:30 - Minis in an ongoing battle with that upper yellow dashed diagonal. 

2:09 - Bigger AUD chart - Possible right shoulder here if I move that support line up to that last low. 

2:06 - AUD/JPY breakdown. 

9:37 - SPX 1m - here is the wedge and the possible breakout. This may be a 5th wave to the 1106 area. Not leaving out the possibility of a backtest.


POMO defined - http://www.newyorkfed.org/markets/pomo/display/index.cfm

Don't believe the statement "there are no operations at this time" - here is the schedule,
http://www.newyorkfed.org/markets/tot_operation_schedule.html

Minis - breakout of the channel and a backtest. Stuck under 97 resistance but above the 30m 200ma with strength in the indicators. This may be looking more like a minor 2.


That was not much of a corrective. I guess 23.6% of the run off 1037 may have to do. At this time I'm thinking that was an A, up for B here, down for C  to near 80 and then the march continues to the 17 to 30 range. That would be my primary call. The bullshit artists may be back in control which may allow greed and fear to ramp this puppy up some more. Greece and the PIIGS are baaaaaack. We all knew they would be. That may be really screwing with Ben's plans here (and with my call to move on up). My alternate call would be to grind out in some sort of massive wedge and consolidate as long as they can hold it up. We all know what the only other option is.

Off to do the big blog. GL today.

September 7, 2010

Morning Post, SPX, S&P 500, E-mini

3:36 - SPX possible falling wedge.Price could not close the gap from Friday morning.

3:32 - Minis channel down.

11:10 - minis possible bear flag - I don't like it as much with the minis 30m being so oversold. We need to get cash and futures on the same page to get a real trend.You can see the 93 level I called as support. If this cracks it should move to 88.

9:32 - SPX 1m chart.On the low volume no domestic news week, I hate the downside call to the 80 range, but that is what I see. Maybe it is Europe's turn to make the markets worry a bit.

Minis off 7 but holding here. Minis 30moversold, but the SPX 30m is extremely overbought and rolling over. Pressure should be down today. What I am seeing is a larger triangle that I believe will keep us possibly consolidated for some time.

September 3, 2010

Weekend Post

11:35 - Minis wedging into the top of the channel here? Dailys don't say so, but the 30 and 60m do. Was that it or is the pop top 17, 31 or even 50 (near that upper green diagonal) what it wants?

 11:21 - My best guess for the dollar is that it is forming a channel down.MACD divergence on weekly does not look good.

11:08 - 10yr treasury, looks like a possible HnS to me at it nears resistance. 

10:54 - AUD/JPY consolidating. 

10:40 - Gold and the multi year wedge. It is consolidating.

10:26 - Minis falling out of the wedge?  That's 17 points to the 38% retrace. Minis up 2 at this time.

Leave comments, links or whatever.

I'll stop by on and off to check the blog. 

Everyone have a safe and fun holiday weekend.

Morning Post, SPX, S&P 500, E-mini

3:06 - Even more rare than UFO/USO sightings these days is a falling RUT. I took this picture for prosperity. 

10:35 - RUT - see the dashed red line with the spike thru it? Looks like something smelled reallybad above it and it retreated quickly leaving a hammer on the 60m chart. RUT is about halfway back thru the gap from this morning. I like 619. Don't give up on the bears just yet as we still have to get thru the low volume lunchtime ramp. It is quite possible that the markets just fall asleep this afternoon as traders leave early for the holiday weekend.

9:49 - SPX 30m stopped right at it's upper BB. MACD whipsawed this morning and other indicators are diverging. The 4hr (yes 4hr - or 1/2 day) is very toppy with S Sto in knots and RSI over 85. MACD is still climbing , but with the signal line over 10 (TEN!) in rarefied air a pullback of some magnitude should be in order. I do not think this is the top. I think we're in a 5-3-5 up to finish C of 2 of P3. She is overthrowing a wedge and is peaking at the resistance line (yellow dashed in the longer chart below). I think the 60m indicators are showing a blow off top. I think sooner than later she pulls back to the 80 to 71 range before the final thrust up to the 17 to 30 range. Could go as high as my old 40 target. I want you all to know that it pains me greatly to say that and I'll throw in the possibility of some horrific global economic development (Greece default or war or terrorist act) that can happen to reverse this at any moment.

9:41 - See that big red line off the two tops - that will be the max (if it even gets there).It is cutting thus at 67 right now. the daily 200ma near that Island gap I used to cream about so much at 1117 should be a major level as well. I still like a backtest of that green diagonal (the old bear market resistance line) to mark the bottom of the first wave down and the launching point for 2 of P3.

9:34 - 56 point ramp with NO retracements. AMAZING!

Morning! I'm doing big blog post. 

Minis larger HnS with a possibly smaller HnS completing the right shoulder is what I see. If you are into symmetry we might churn in the range for another month. Possibility of maybe 10 points more to the upside. Let's see what the jobs number does before we get ahead of ourselves.

September 2, 2010

Morning Post, SPX, S&P 500, E-mini

3:46 - Minis megaphone

1:41 - In honor of the kickoff to the college football season the minis have decided to greet us with a nice 1m megaphone. GOOOOOOO FED! CHEAT 'EM! YEAAAAAAAAA

12:07 - it is trying to roll over here. Bears have to crack that blue line with conviction or it will continue to churn up. 86 should hold. it is that VWAP price has to get under. RUT, SPX and NAS about to 30m bear cross. DOW is there. Minis 30m is in a knot.


10:51 -  Possible channel and upper resistance line. 10m divergences are very obvious.

10:35 - I hate Pissani. Minis slowly channeling up in a narrow band. Not much else to say. No real action this morning and I expect it to stay quiet for a while.  Daily SPX 50ma at 81 and price above it at 84. She's cracked it. Next gap resistance is at 92 SPX.

10:13 - TBT daily - even more bullish if the Fed wants to move things around as their next phase of forcing funds into equities and out of bonds is persistent and successful.  Notice a nice potential triple top at the 38% 37.75 (that reflects the SPX 1130 level if all remains constant).

10:07 - TBT chart -Possibly breaking out here.

9:35 - SPX with gaps and fib at upper 1m BB that is exceptionally wide right now.

I think we gotta get some of the pop out eventually, si I'm rolling with the 30m divergences but not promising much downside. We have learned that little is predictable in this data driven manipulated piece of crap thing we call a market.

Off to do the big blog which will have much more detail.

Even the 60m has divergences - these diagonals are oddly symmetrical.
 Fibs on the minis are - 67, 61 and 55. The support I like the most are at 70, 61, 58 and 54.

As for the upside targets 86, 97/00, 04, the island gap at 17 and then 27.

Confusion reigns in the world of TA. I'm seeing calls from 940 to 1140. Counts are everywhere and some of the most reliable are just like me looking up and down waiting on clear trend to show up. This range bound churn is wearing on a lot of people.

September 1, 2010

Morning Post, SPX, S&P 500, E-mini

11:24 - BEEEEEEEEEEEEEEEEEEEEEEEEEEEEEEEEEEEEEP - Anyone got a defibrulator?


10:30 - RUT 1m today - I'm looking hard at TZA. May go light and then as confirms add. 

10:10 - anyone into symmetrical moves?

9:43 - Possible breakout.Given the position of the daily indicators you must heed the possibility. Given the 30m charts you should be thinking pullback then confirmation. This 60m candle still has 45 minutes to go, so it can be misleading here.

9:20 - 30m very overbought and embedded. Looks like one of two things, either a tripple bottom reversal or a descending triangle that should show continuation.Confusion reigns!


I guess ToS fixed their chart loading issues by DELETING all my trendlines in the charts section. Thanks guys. I appreciate that.


Minis up 10.75! Now 13!

30m very overbought. I'm off to the big blog. Let the guessing games continue. Will be back with more later.